
KRYPTOVIZION is the only high resolution cryptocurrency market analytic platform that allows easy market analysis by providing true market moving data. KRYPTOVIZION features live aggregated spot price, live market moving orders, live liquidations, live orderbooks, true leverage volumes, leverage density, true liquidation levels, and the GEX Profile. After thousands of hours and billions of data points analyzed, KRYPTOVIZION's analysts have stripped out the noise, the wash-trades, the inflated liquidation figures, and the phantom leveraged positions that carry near-zero predictive value and quietly distort trading strategies. What remains is signal: the cleanest, most accurate representation of leveraged market structure available for every major cryptocurrency traded on margin.
Real-time price aggregated across exchanges with forced liquidation events and large institutional orders overlaid at the exact price level of execution. Liquidation events are captured from Binance, Bybit, and OKX forceOrder streams. Institutional-size trades sourced from live feeds across all connected exchanges.
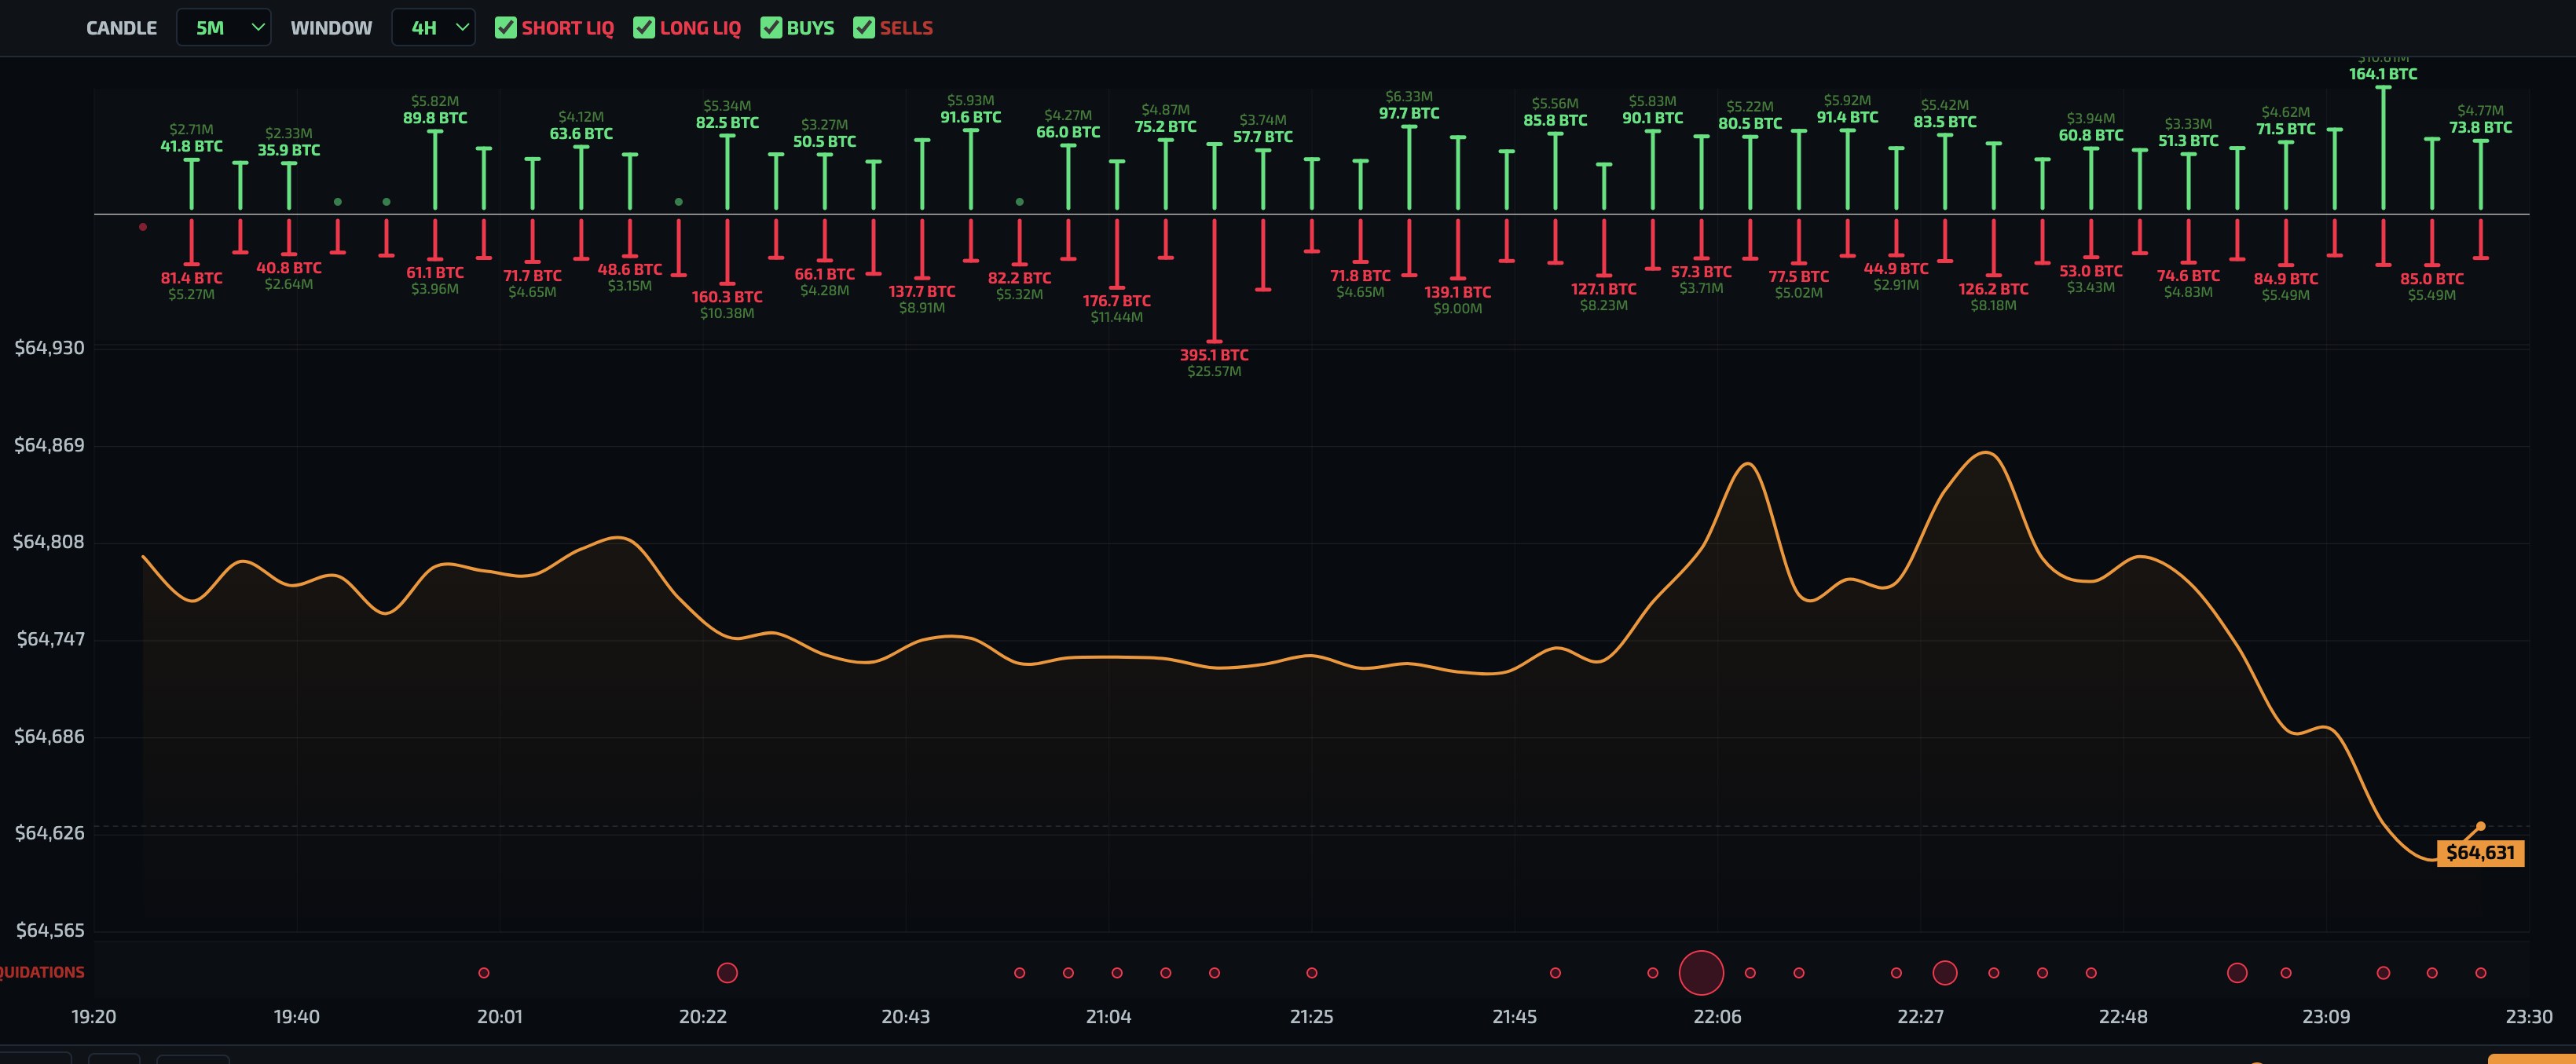
- Liquidation overlays — long and short forced-liquidation events rendered at the execution price with cumulative USD values
- Institutional order overlays — buy orders above the price line, sell orders below, with per-event and cumulative dollar amounts
- Configurable candle resolution — 1-minute, 5-minute, or 15-minute aggregation with lookback windows from 1 hour to 72 hours
- 72-hour DVR playback — pause, step forward/backward by one minute, or scrub through the full history using a slider control
Maps estimated forced-liquidation volume above and below the current price across a configurable range. Open interest from each exchange is decomposed through a multi-tier leverage distribution with weights derived from thousands of observed liquidation events. Calibration uses a proprietary divisor system to match predicted fuel against actual observed clearance volumes.
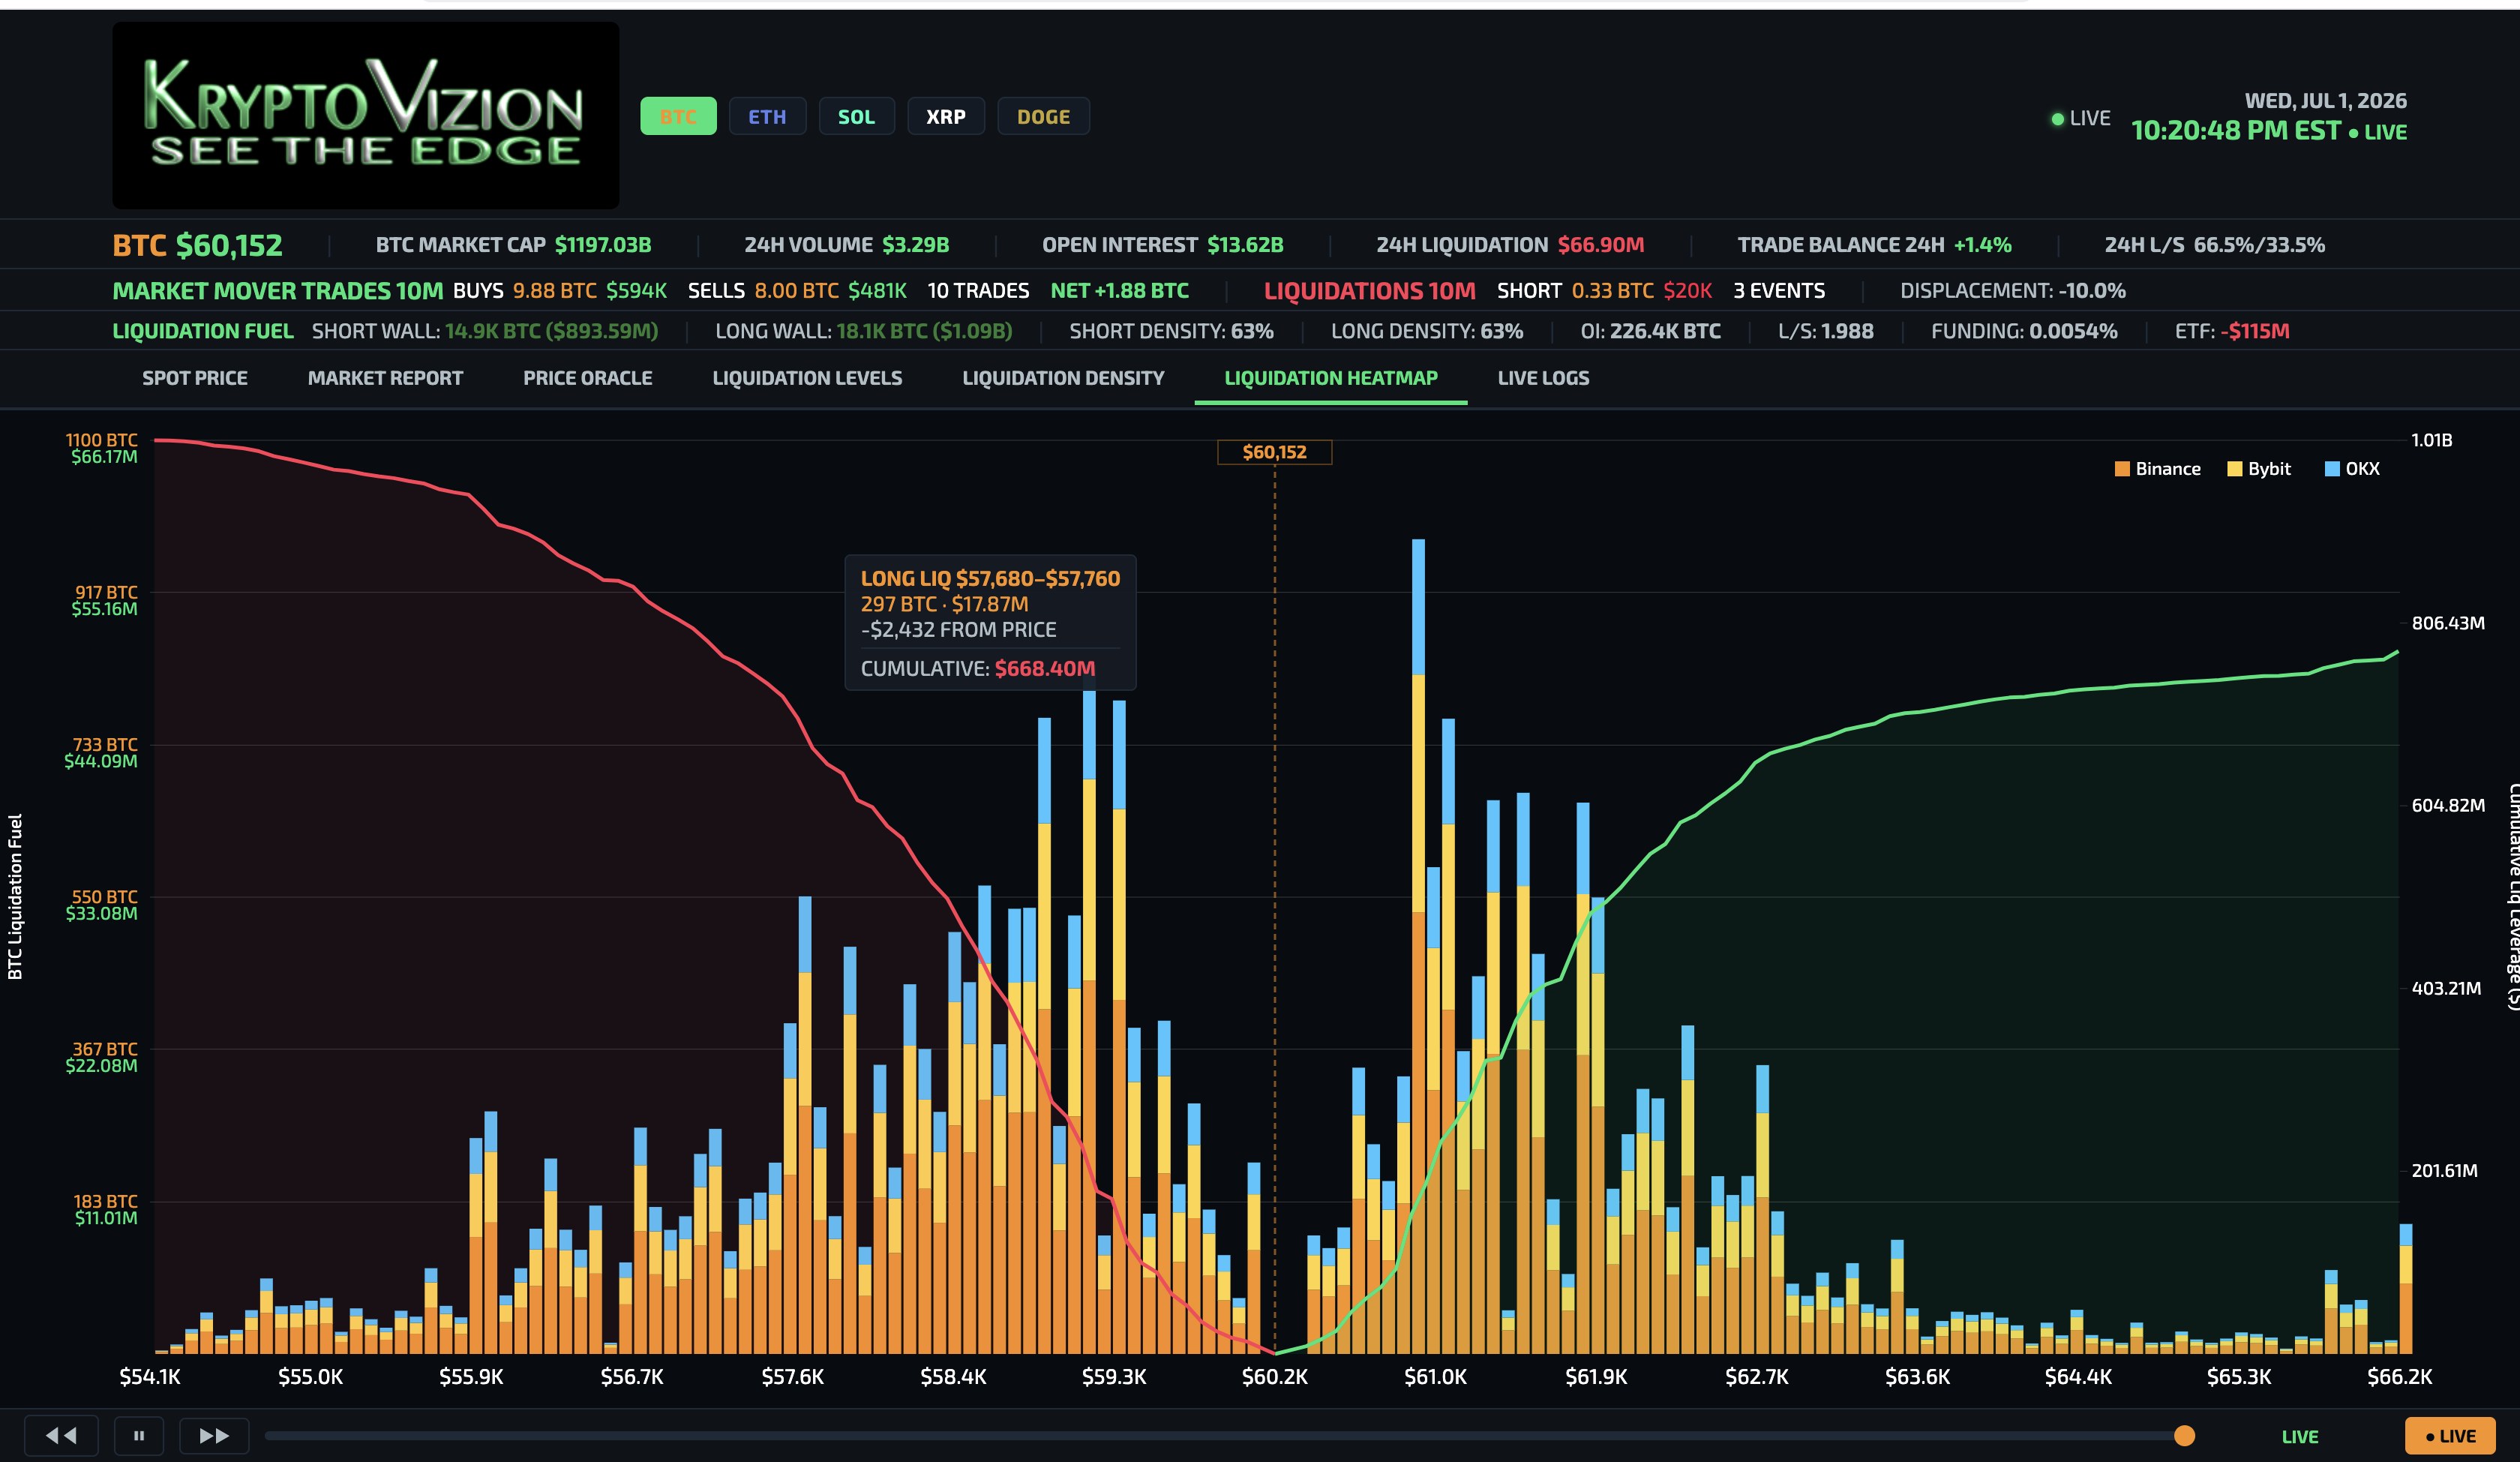
- Exchange-weighted bars — Binance, Bybit, OKX displayed proportionally to their share of total open interest
- Cumulative leverage curves — total estimated forced-liquidation volume in each direction from the current price
- Candle-based entry distribution — positions modeled from historical price levels where they were actually opened, not uniformly distributed around the current price
- Asymmetric output — the model reflects actual directional positioning imbalances rather than forcing visual symmetry
- DVR rewind — heatmap snapshots stored per minute, rewindable across the full 72-hour window
Classifies each liquidation cluster by the weighted average leverage of the positions that would be forced-liquidated at that price level. A cluster dominated by high-leverage positions has low structural density — it will clear rapidly with minimal sustained price pressure. A cluster dominated by low-leverage positions has high structural density — it requires prolonged directional movement to clear and is more likely to absorb momentum than accelerate it. This distinction is critical for identifying which price levels will act as acceleration zones versus reversal zones.
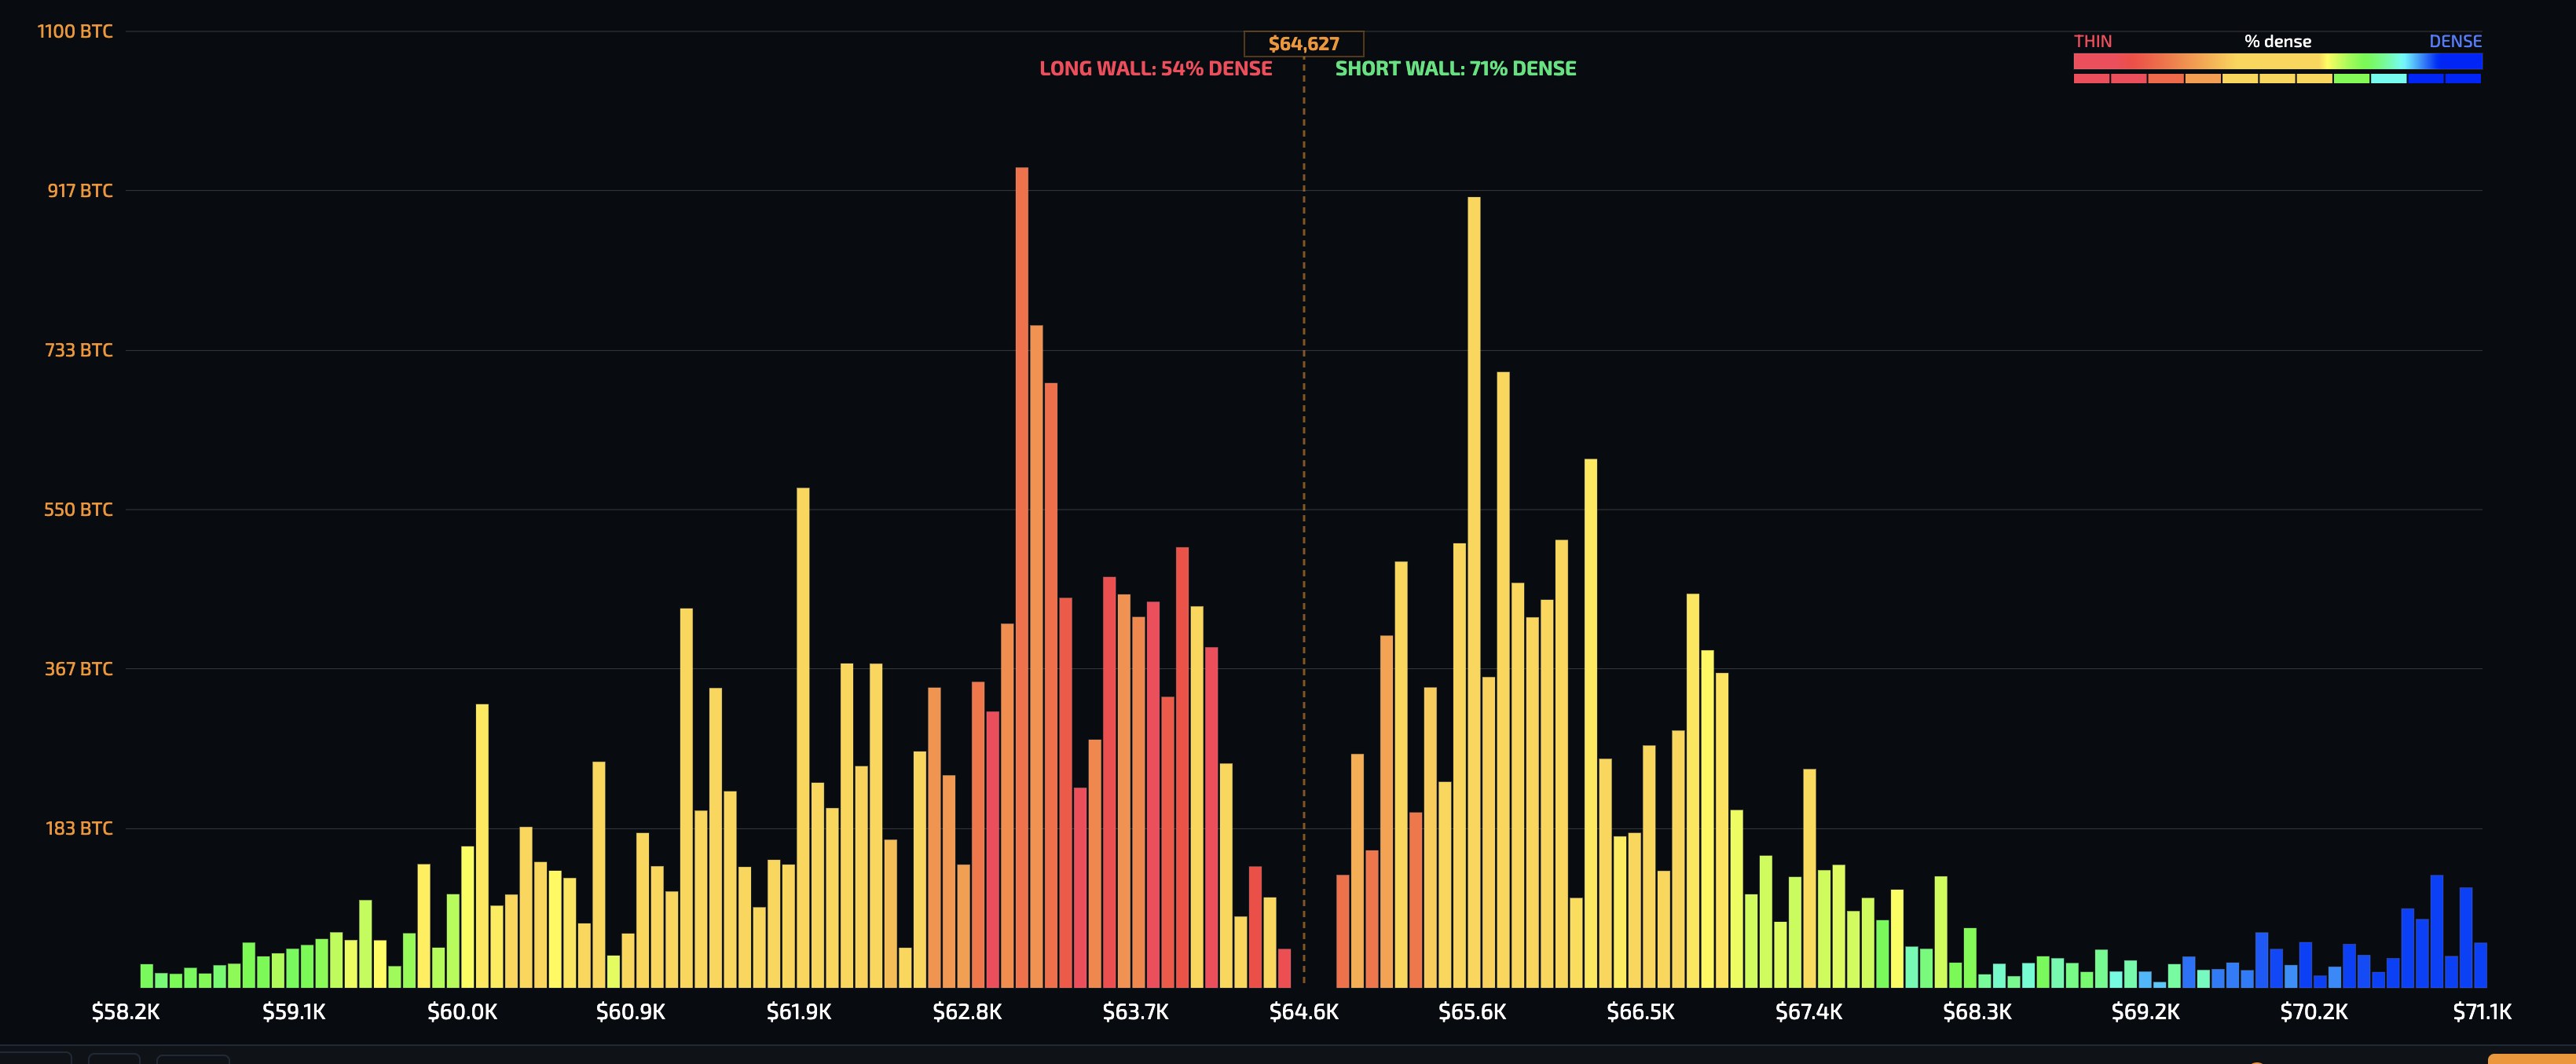
- Multi-tier leverage decomposition — each price bin scored by the weighted average of its leverage composition across all modeled tiers
- Color-coded output — red (low density, high leverage, fragile) through yellow (moderate) to blue (high density, low leverage, structurally resistant)
- Weights derived from observed data — the distribution was calibrated against thousands of actual liquidation events, revealing that prior industry assumptions about leverage concentration were significantly incorrect
- Cascade trajectory estimation — density scoring predicts the velocity profile of a liquidation cascade before it occurs
Records every observed forced-liquidation event in real time from Binance, Bybit, and OKX streams. Each event includes the exchange, direction (long or short), execution price, position size in BTC and USD, and the density classification of the price zone at the moment of clearance. Aggregated into rolling time windows (1h, 4h, 12h, 24h, 48h, 72h) with cumulative totals per price level and liquidation velocity measured in BTC per second.
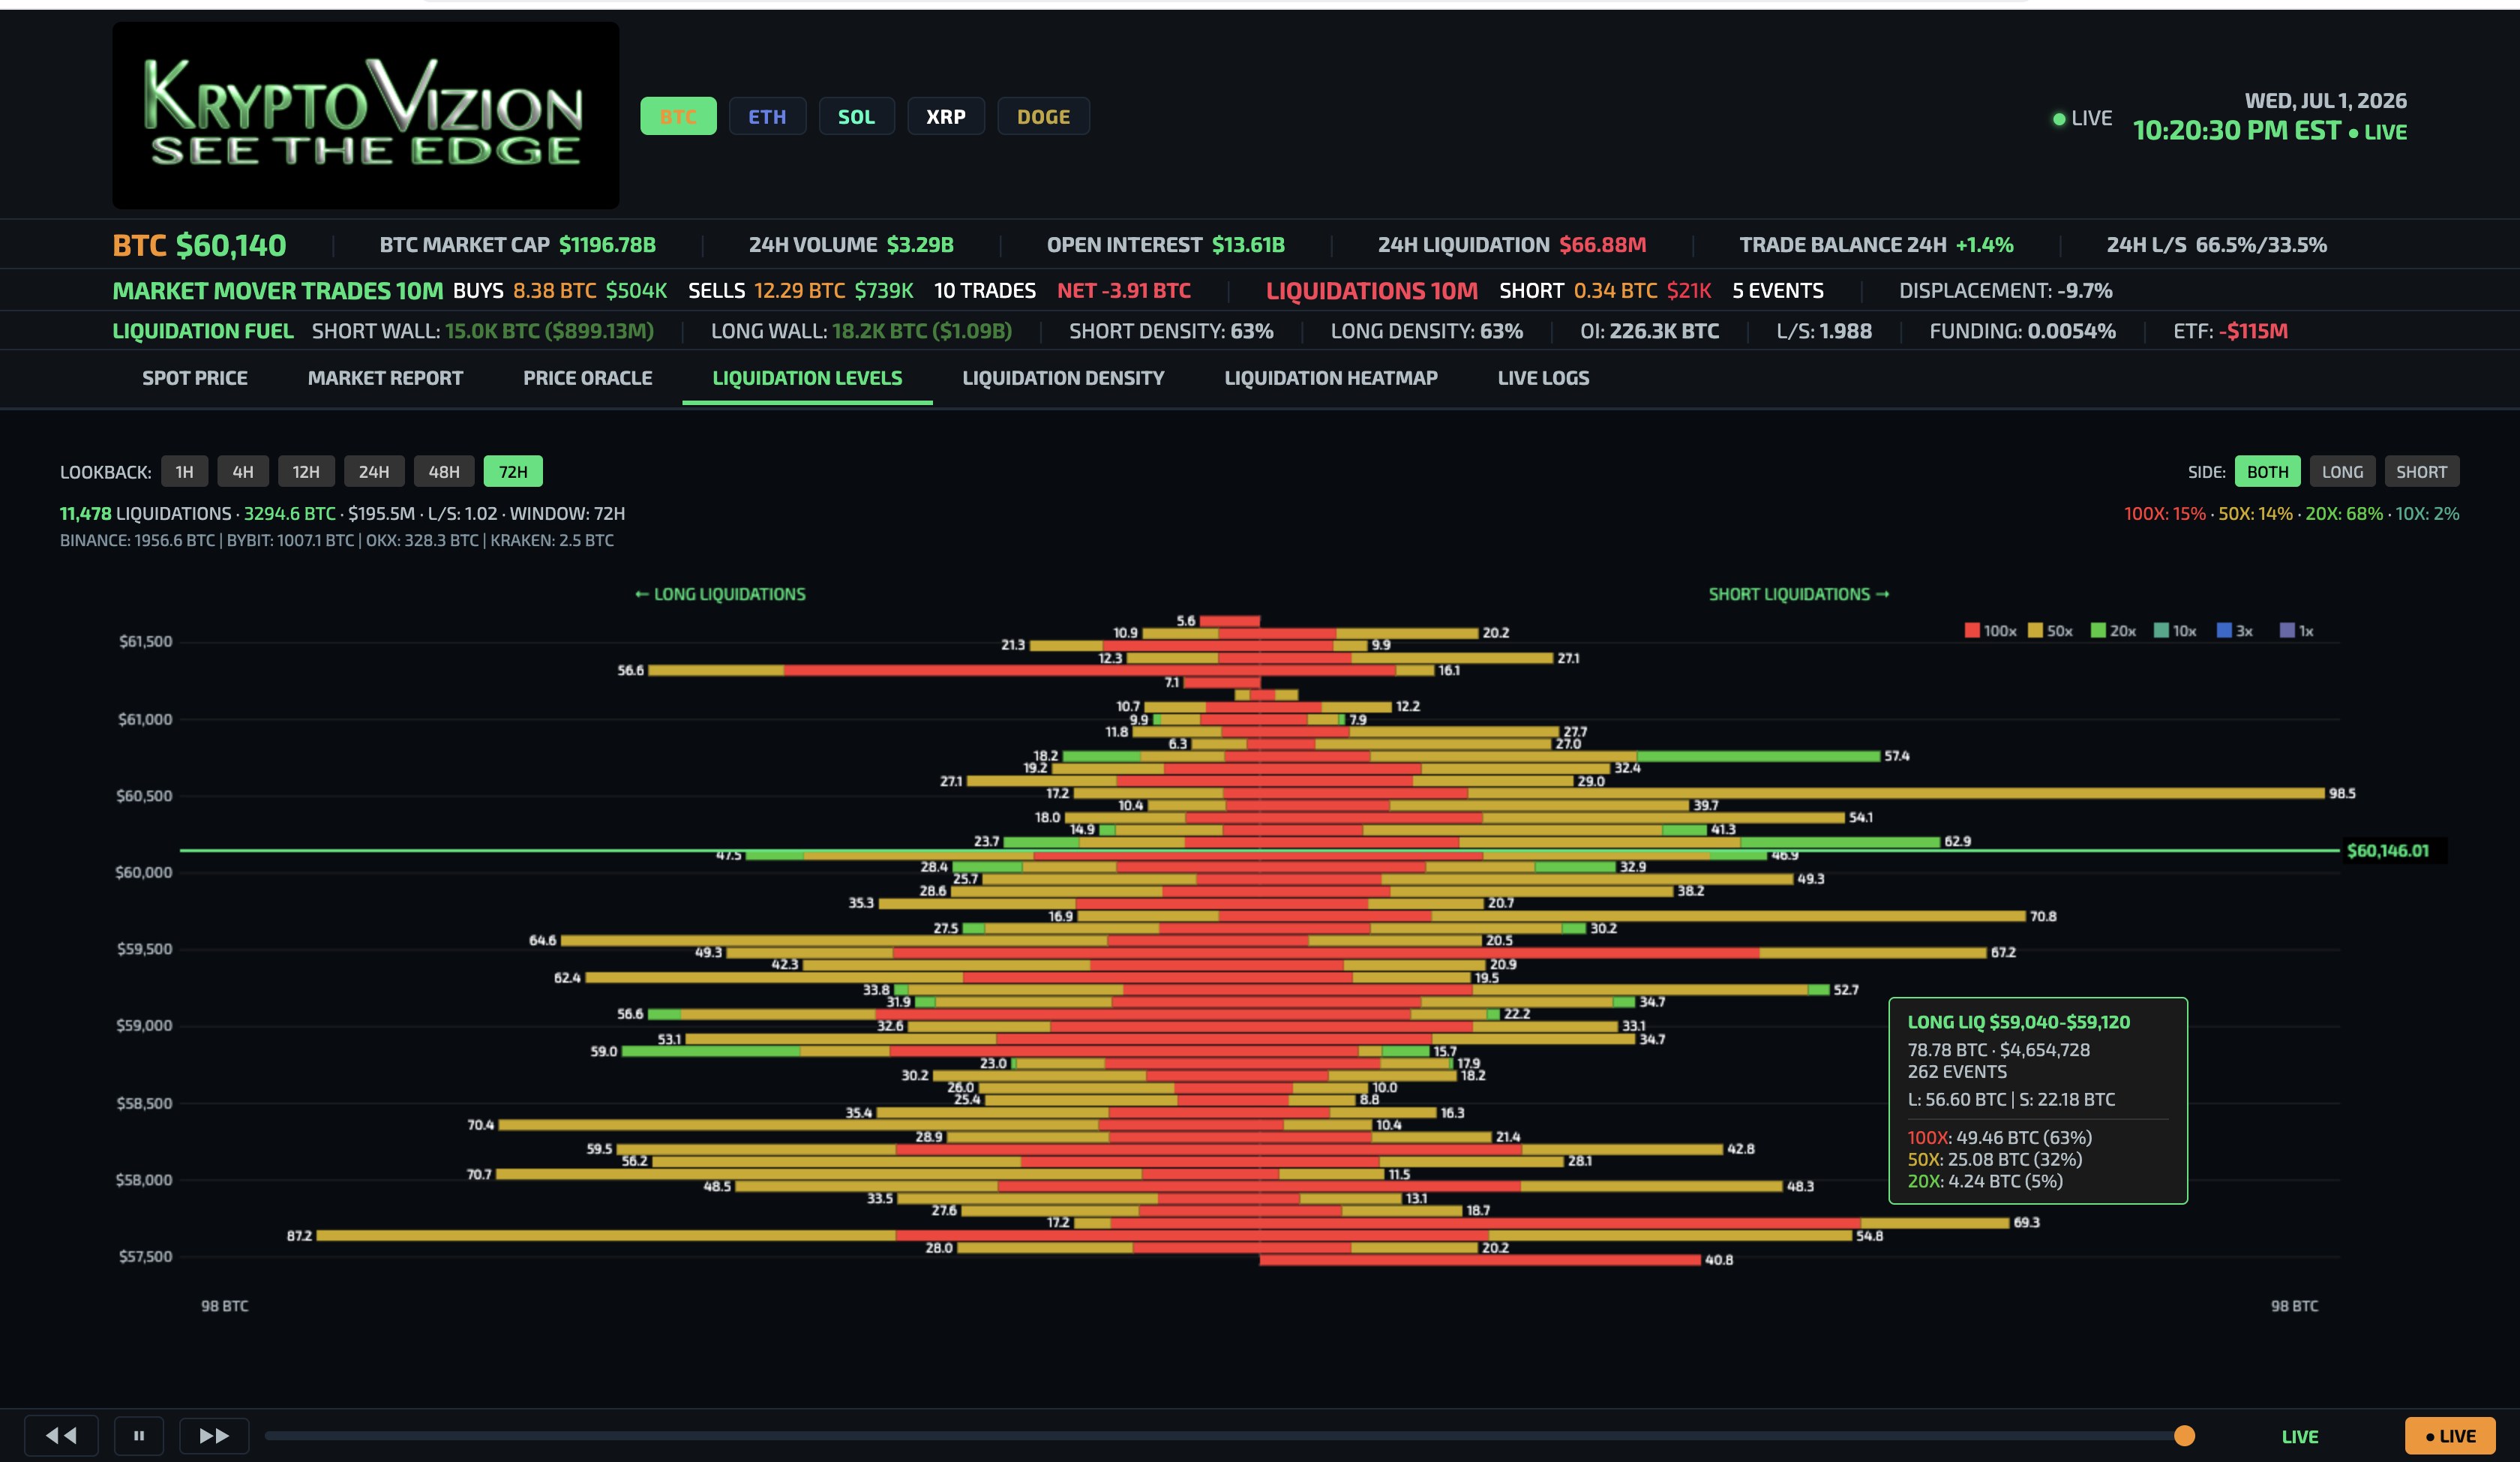
- Per-event logging — exchange, side, price, size (BTC and USD), timestamp
- Density at clearance — was the fuel at this level low density (fragile, high leverage) or high density (structurally resistant)?
- Cumulative zone totals — aggregate liquidation volume at each price level over the selected time window
- Liquidation velocity — BTC liquidated per second, used to detect and classify cascade chain reactions
Raw market microstructure data in a four-panel layout. The top-left panel streams market mover trade flow — institutional-size orders detected from exchange WebSocket feeds, classified by configurable size tiers. The remaining three panels display per-venue order book depth resilience computed at high frequency from REST depth snapshots across multiple band widths.
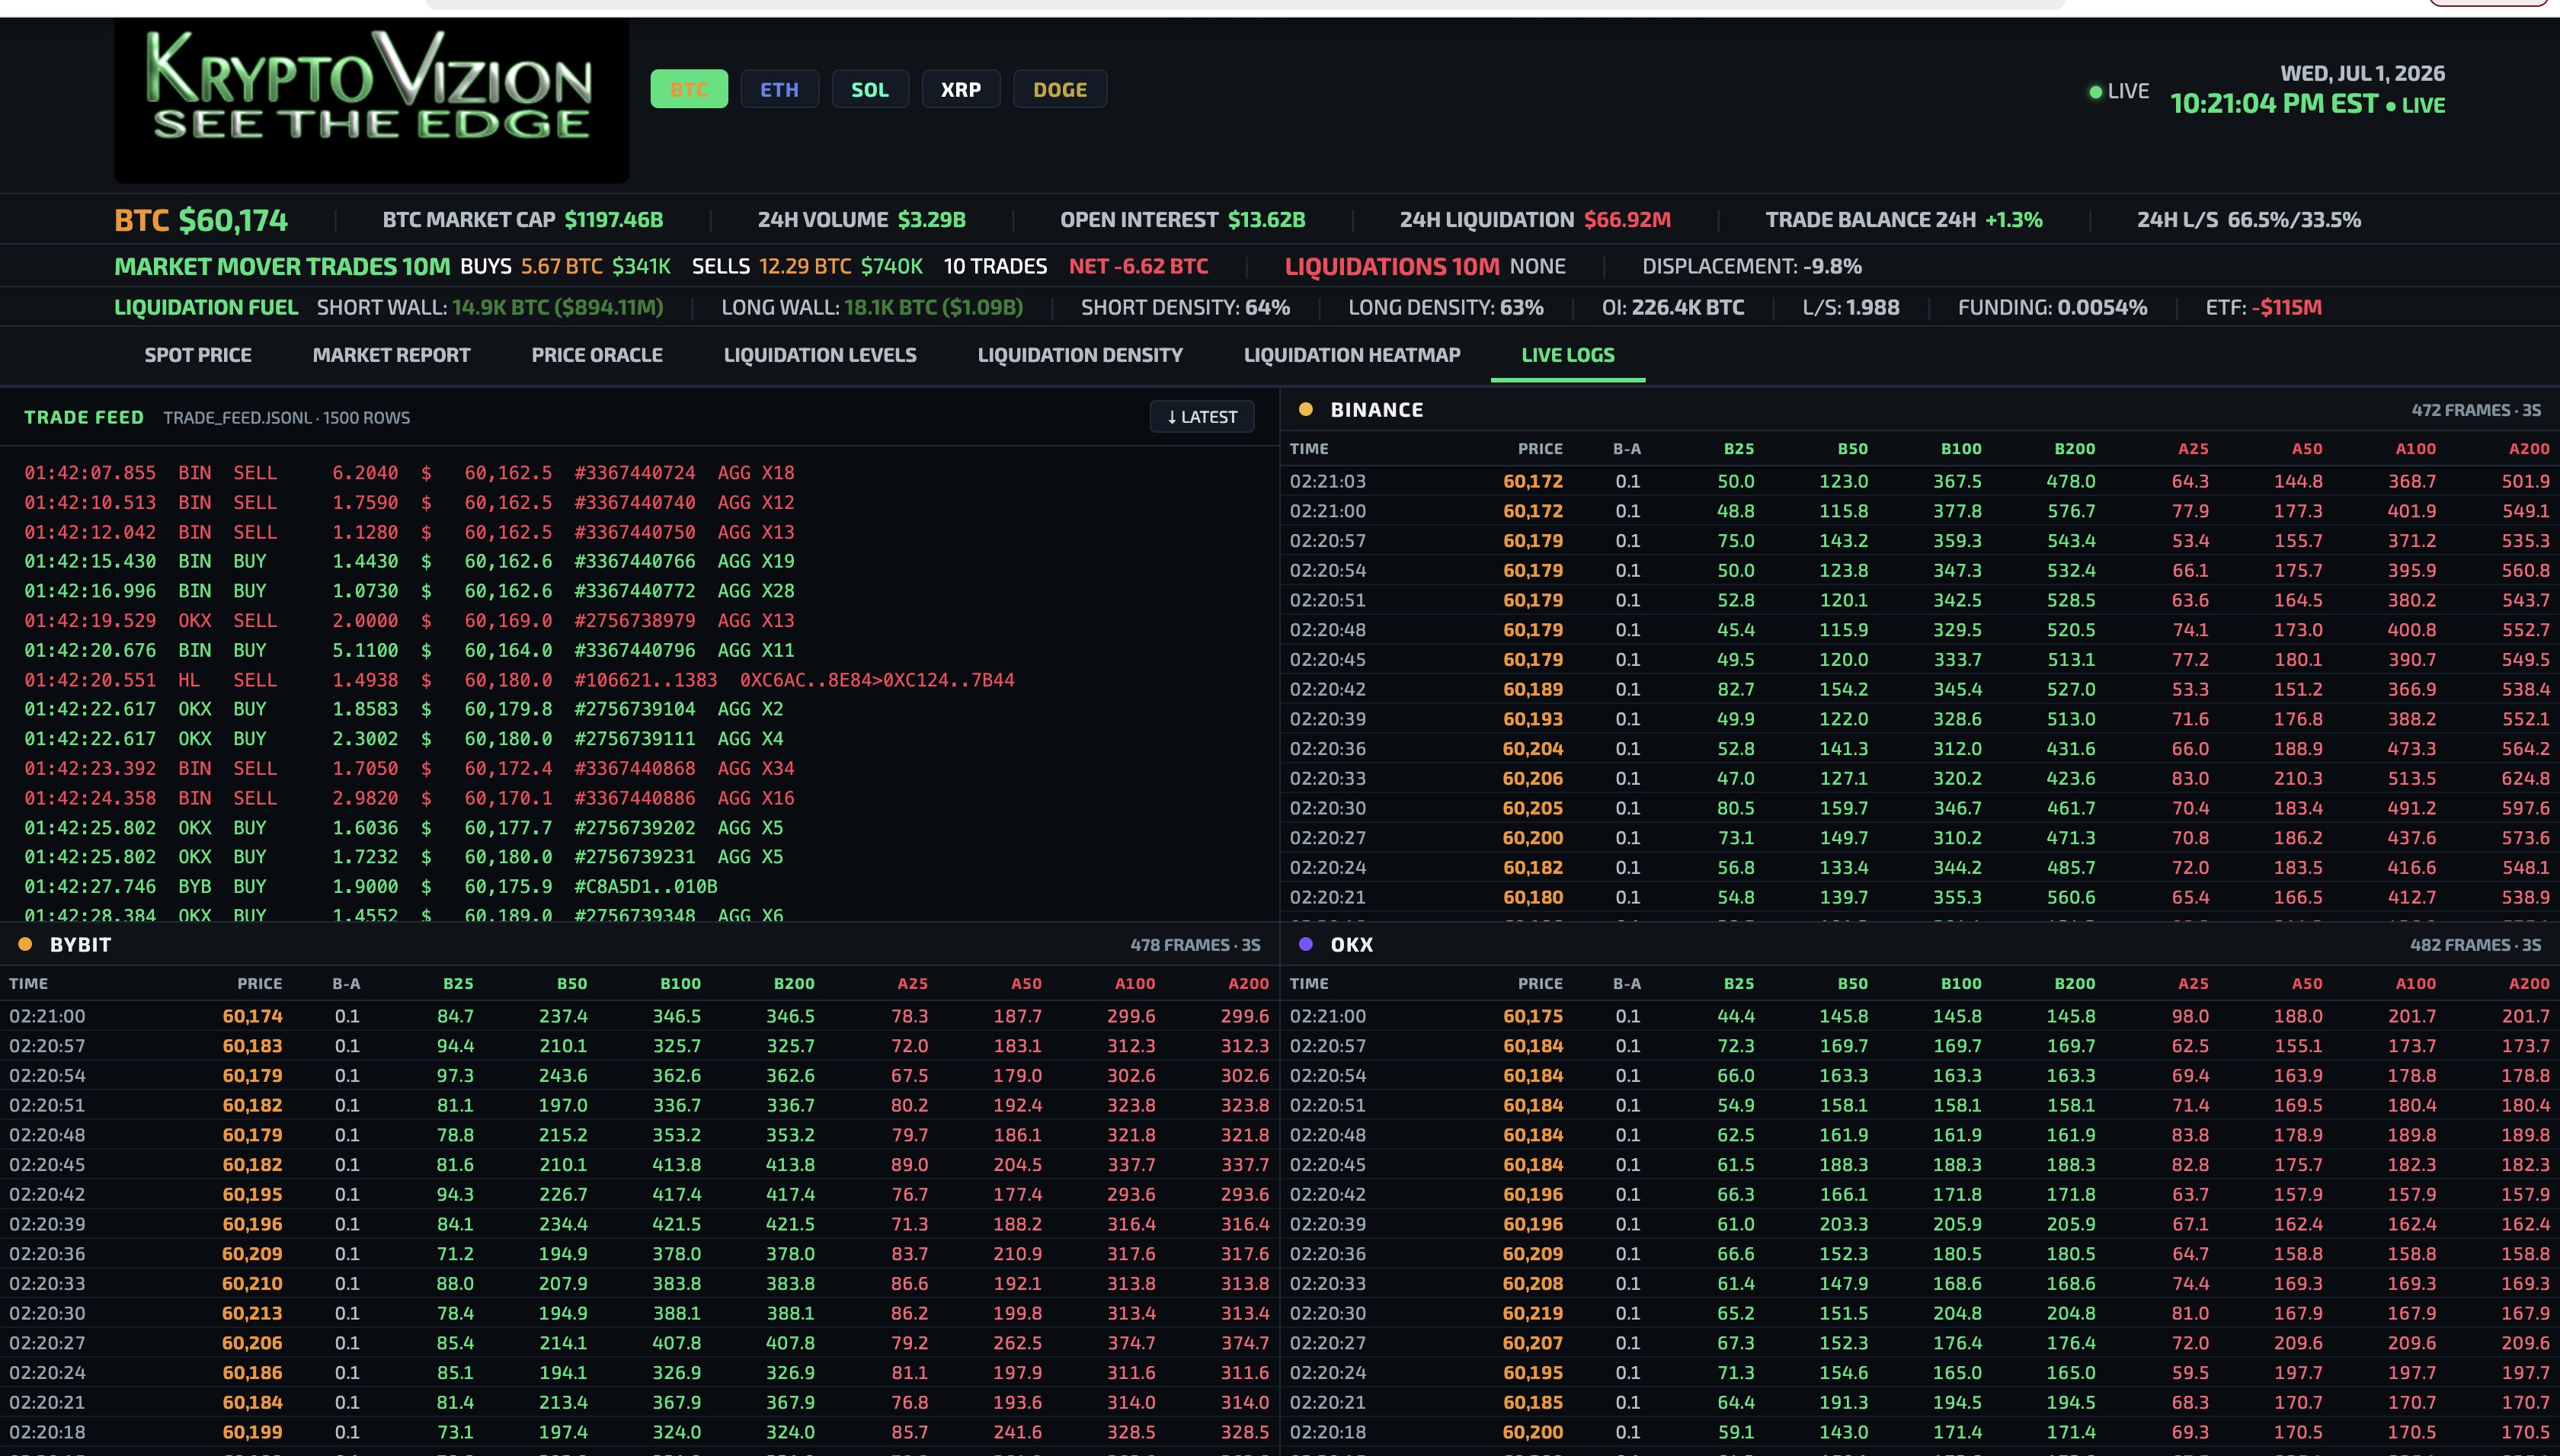
- Trade flow panel — institutional orders with exchange, direction, size (BTC and USD), and classification tier
- Per-venue depth panels — Binance, Bybit, and OKX bid/ask depth across configurable depth bands, computed from exchange REST depth endpoints
- Independent scroll — each panel scrolls independently for individual analysis
Institutional options order flow from derivatives exchanges. Captures calls, puts, and multi-leg structures with strike prices mapped against the liquidation heatmap. Net dealer gamma exposure identifies price levels where market makers are mechanically required to hedge — creating predictable, non-discretionary buying or selling pressure. Negative gamma below the current price means dealers amplify downward moves; positive gamma above means they dampen upward moves.
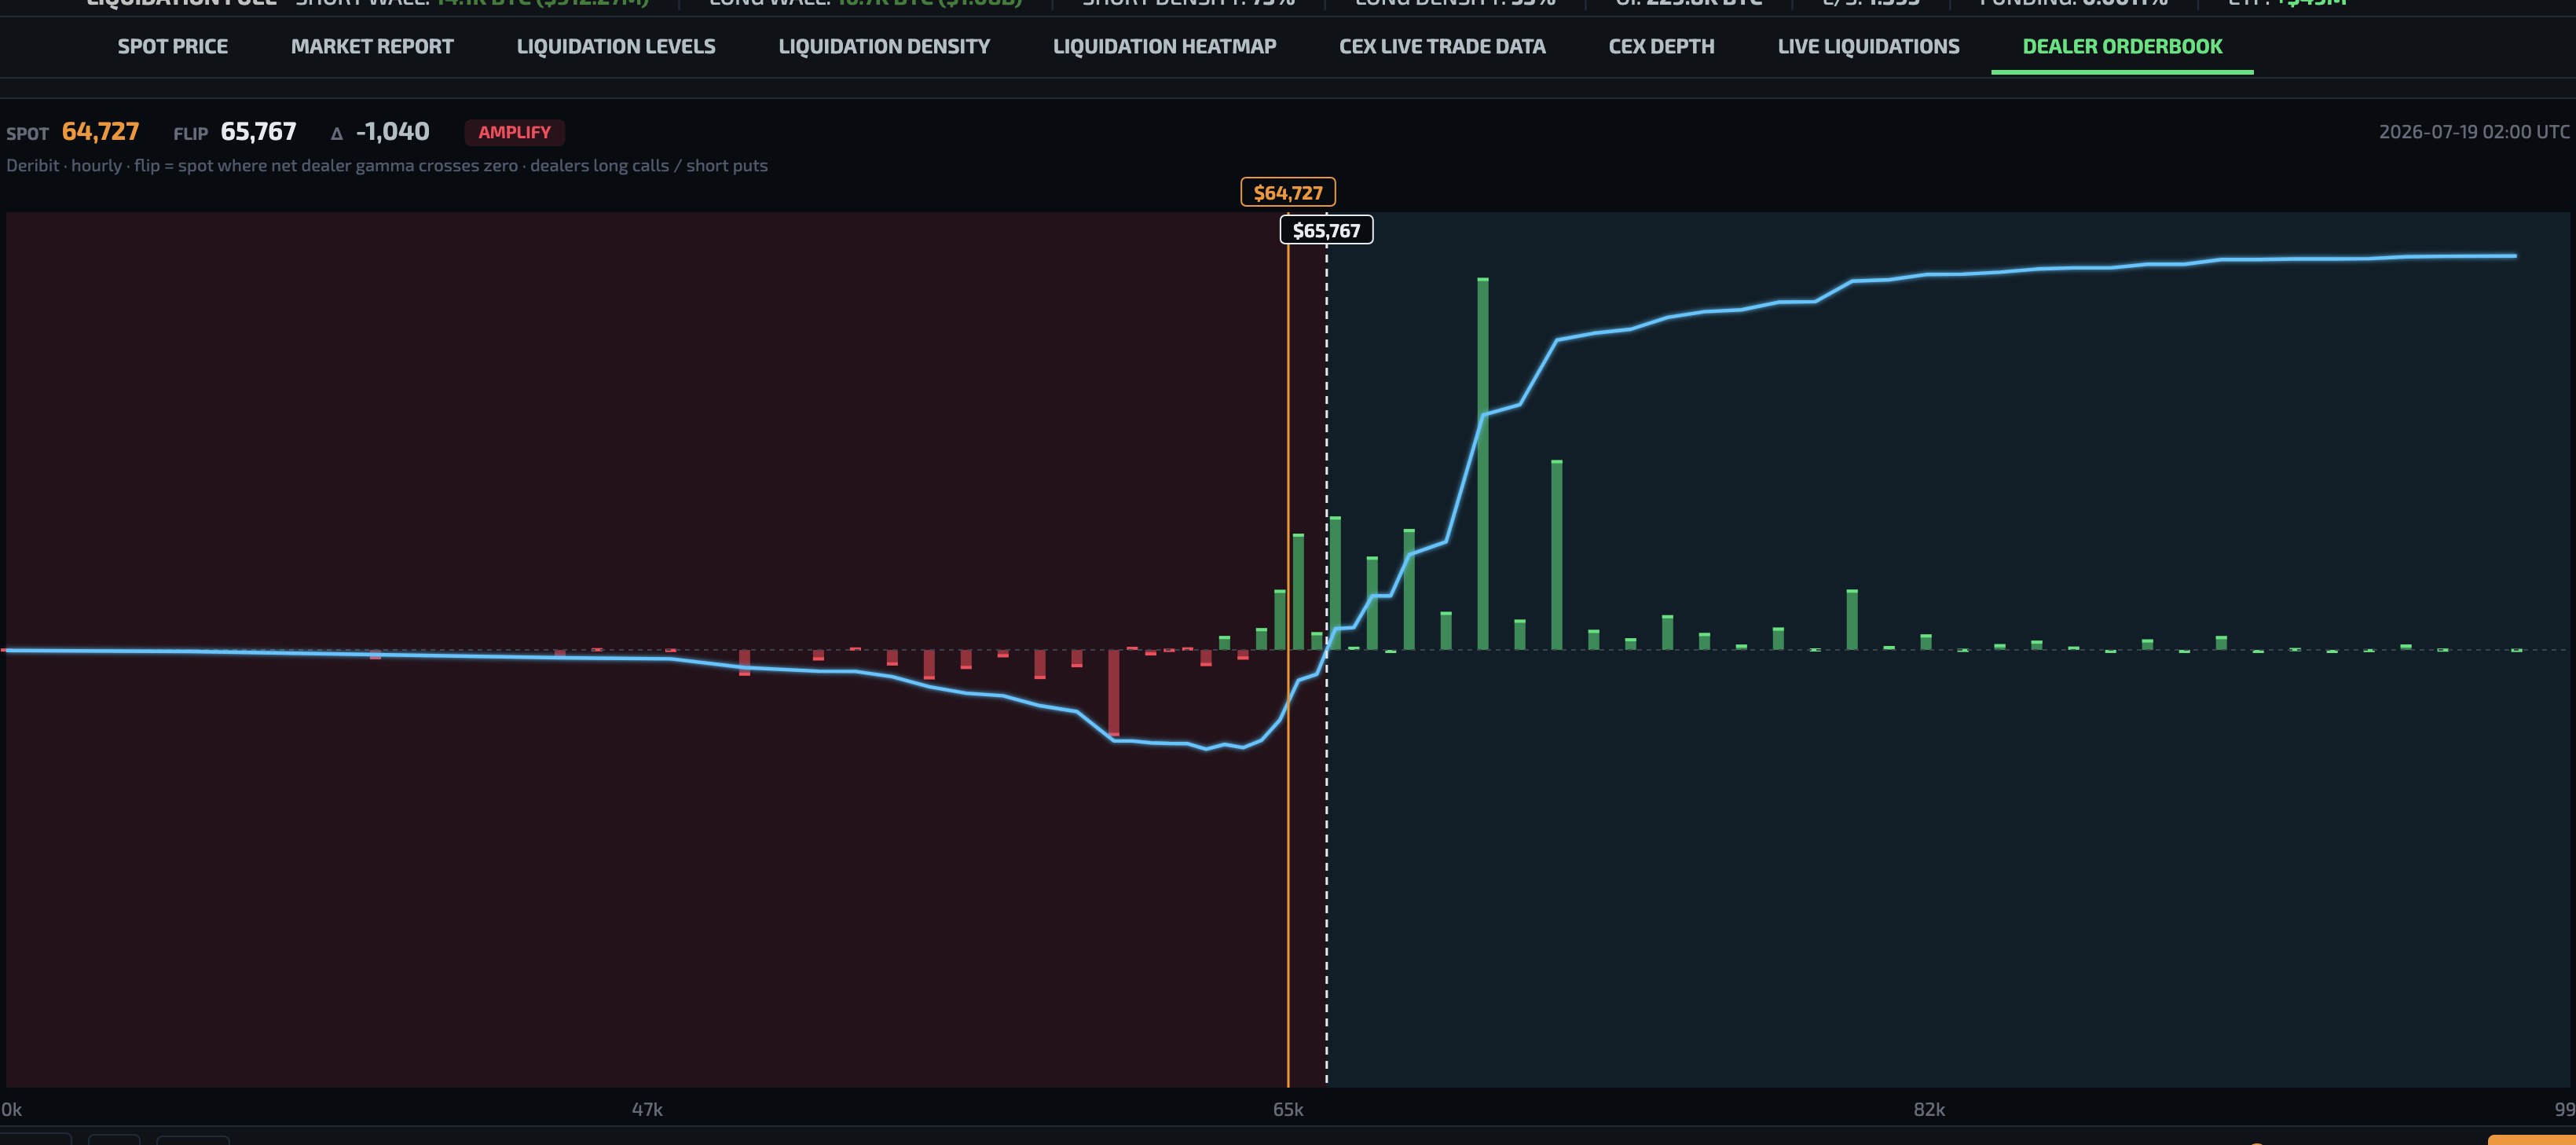
- Live dealer options orders — calls, puts, vertical spreads, and structured products with strike, expiry, size, and implied volatility
- Net dealer gamma exposure — computed per strike, identifies forced-hedging zones that create mechanical price flow
- Block trade detection — large off-book and on-screen trades flagged with size, direction, and premium paid
- Open interest by strike — max pain calculation and put/call ratio with historical shift tracking
- Gamma-liquidation convergence — identifies price levels where options gamma hedging aligns with leveraged liquidation fuel
Real-time resting liquidity across Binance, Bybit, and OKX, shown side by side and binned by distance from spot. This is the layer that actually sets price — bids and asks reshaping before any trade prints. Watch where the walls sit, which side is thinning, and which venue leads, so you can see liquidity being pulled ahead of a move rather than reading it after the fact on the tape.
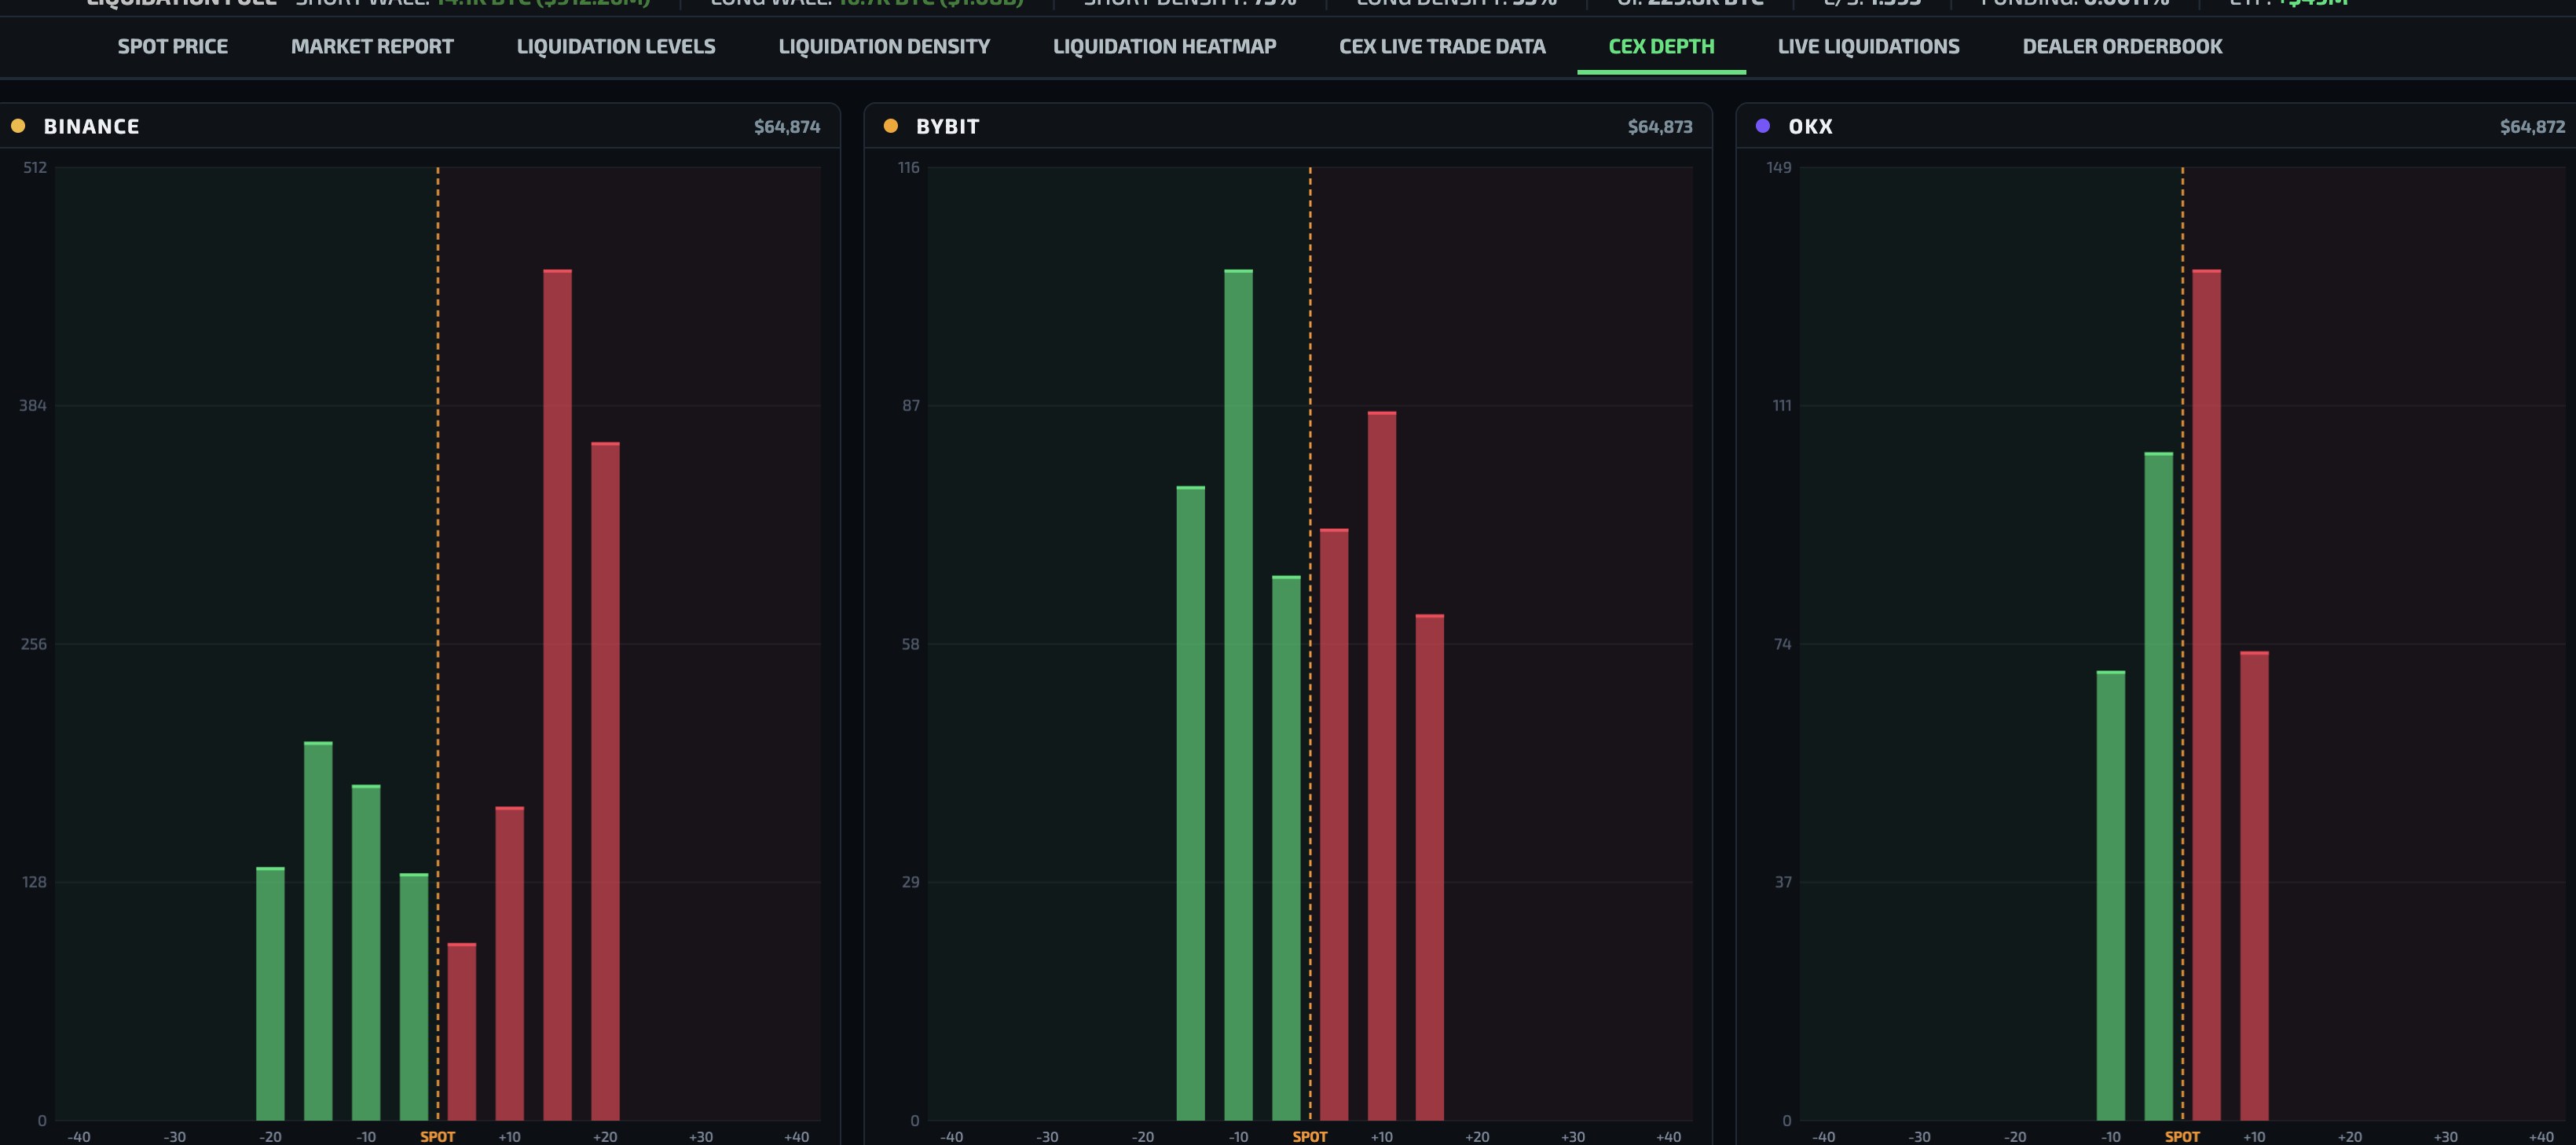
- Per-venue profiles — Binance, Bybit, and OKX order books rendered independently, bids left / asks right of spot
- Fine-grained bins — resting size bucketed by basis points from spot, out to the edge of the meaningful book
- Pull detection — see liquidity withdrawn (cancelled) versus traded, the mechanism behind book-driven grinds
- Cross-venue comparison — spot the venue carrying the move and divergences in resting depth between exchanges
Prepared by AI and generated twice daily at 06:00 ET and 18:00 ET. Provides session context (Pre-Market, US/EU Overlap, US Session, Transition, Asian Session), fuel zone positions with gravity bias calculation, open interest decomposition by exchange, funding rate, long/short ratio, ETF flow data (BTC and ETH weekly net flows with streak tracking from Farside Investors), and a five-component sentiment composite with directional cascade probability estimation.
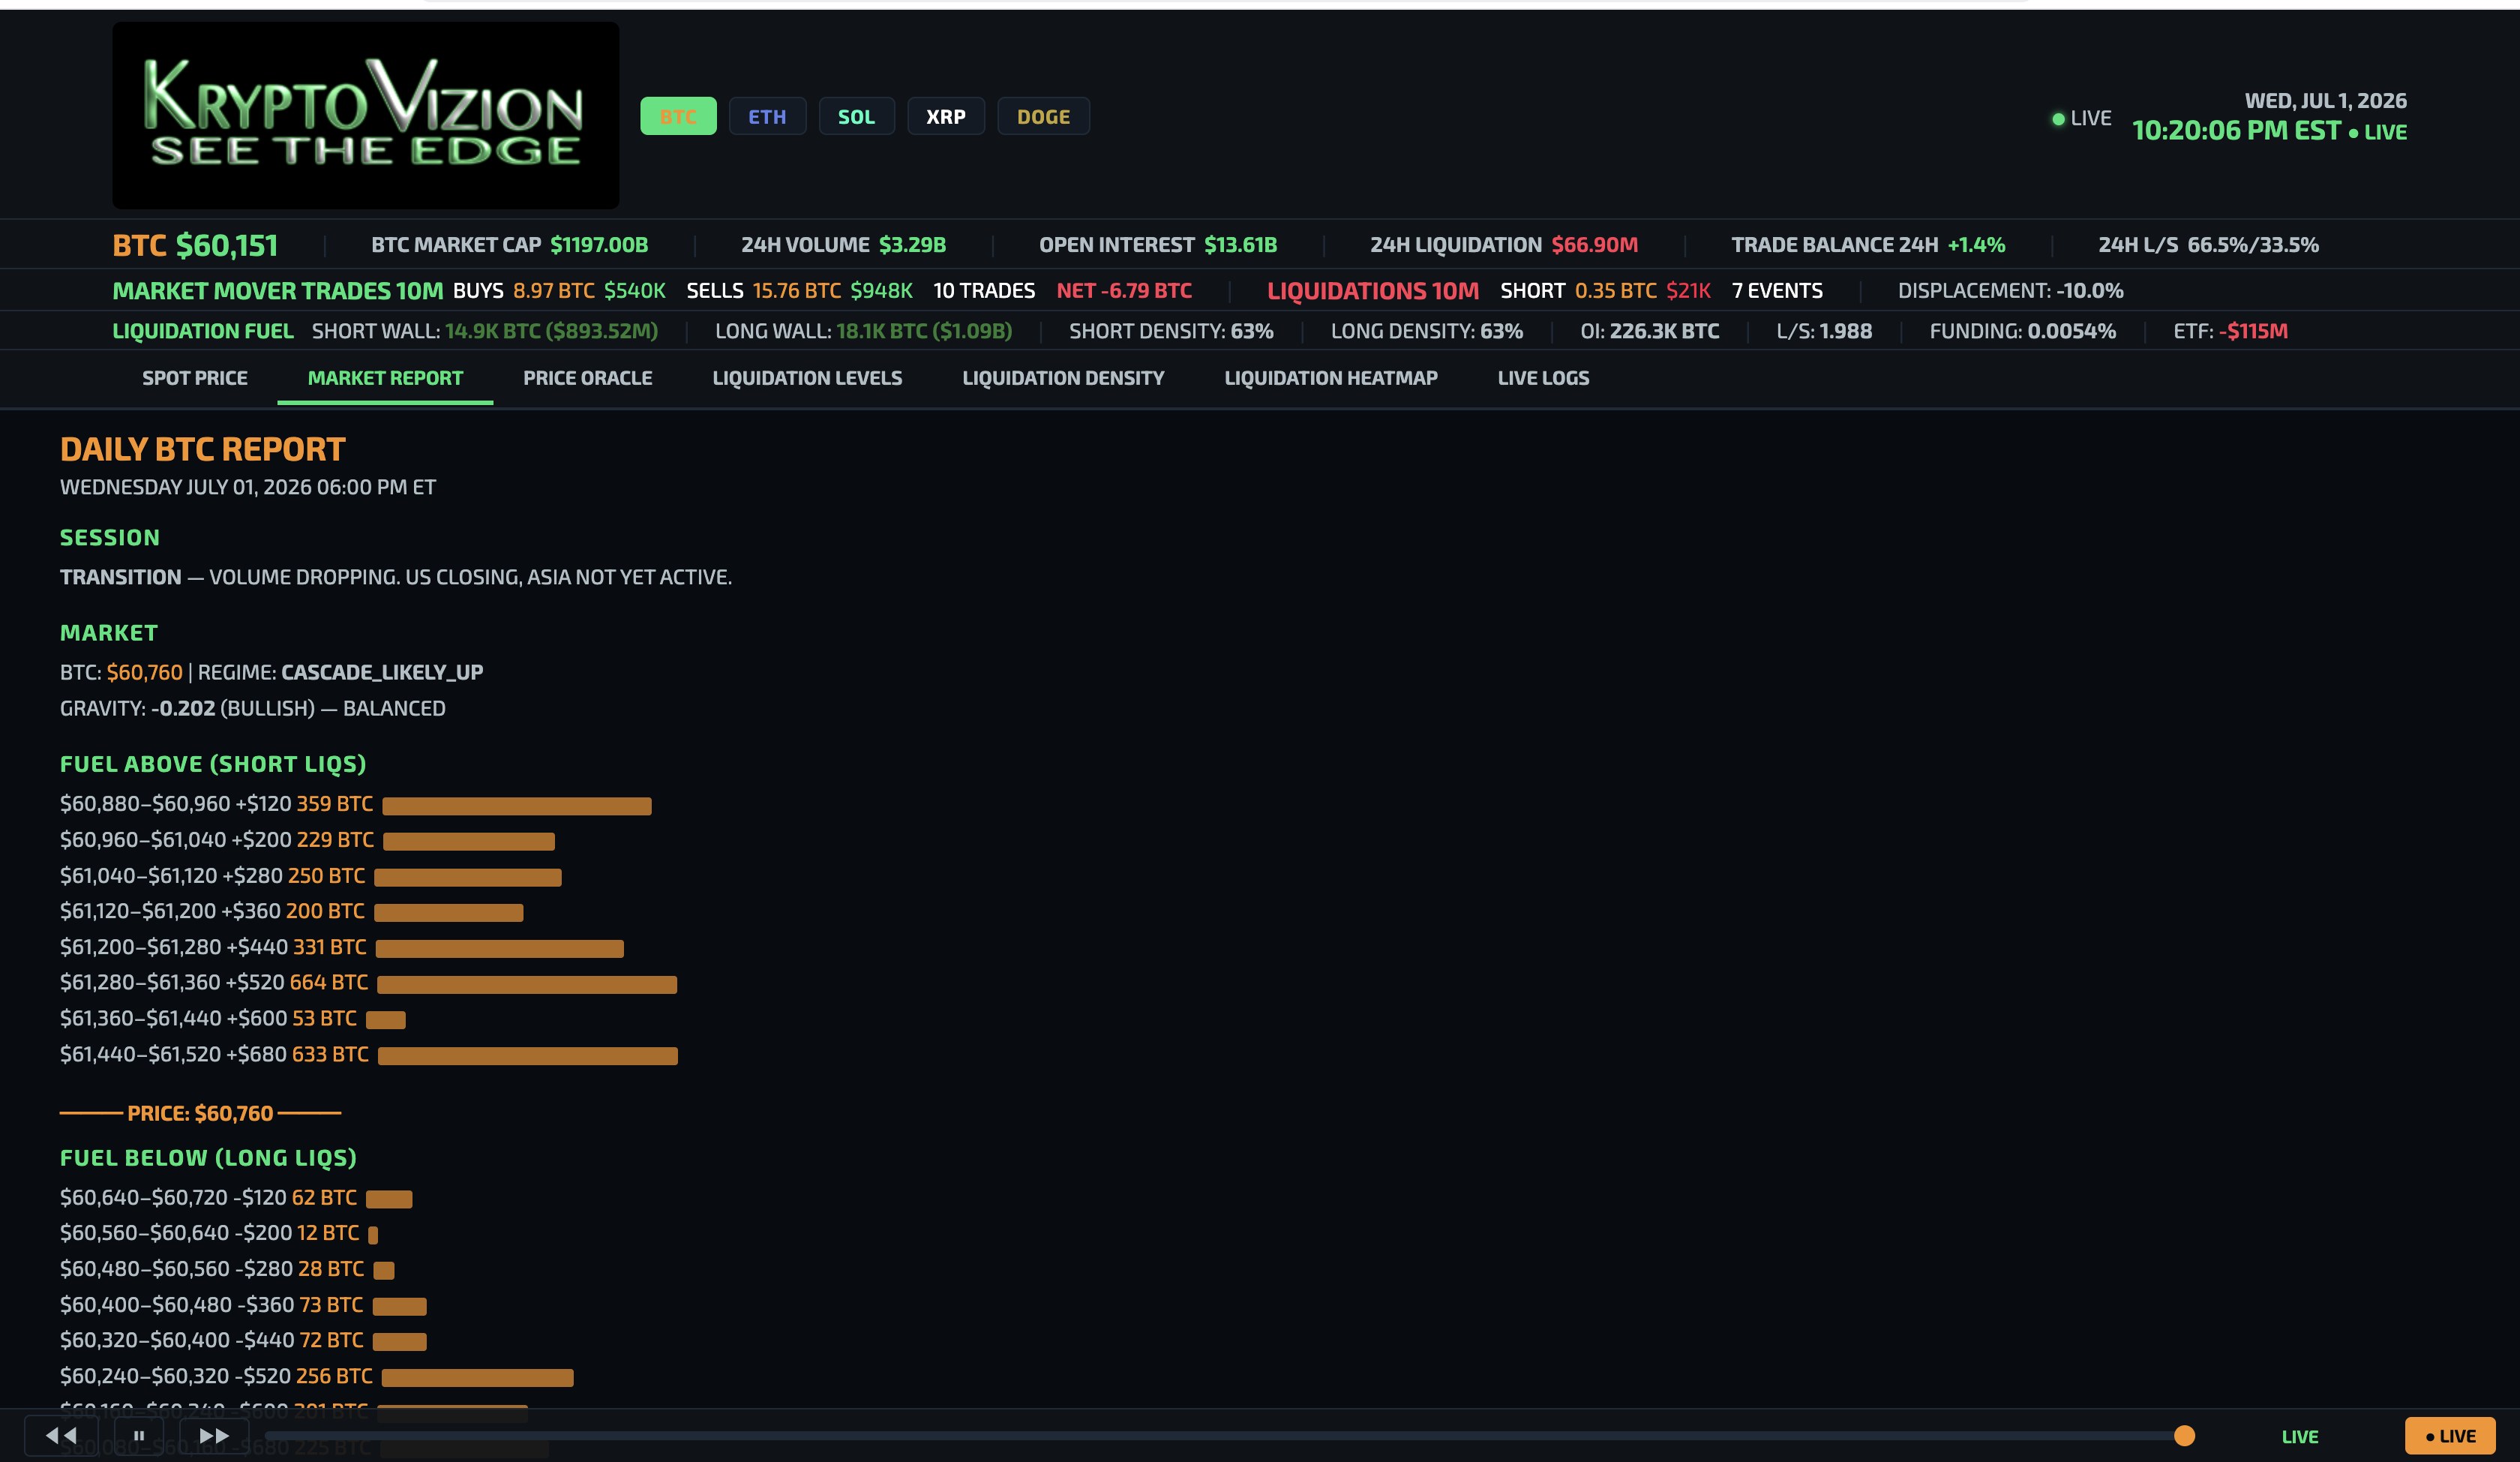
- Session identification — current trading session with volume profile context and characteristic behavior patterns
- Fuel zone positions — short liquidation fuel above price, long fuel below, with BTC amounts and distance from current price
- Gravity bias — directional pull metric derived from the asymmetric distribution of liquidation fuel. Positive = more fuel below = bearish pull
- Open interest decomposition — Binance, Bybit, OKX individual and total OI in BTC and USD, with long/short ratio and funding rate
- ETF flow tracking — BTC and ETH spot ETF weekly net flows, inflow/outflow streak, total AUM, sourced from Farside Investors
- Sentiment composite — five-component score (liquidation structure, institutional activity, market metrics, macro catalysts, cycle position)
- Cascade probability — model-estimated directional probability of a liquidation chain reaction in the upcoming session
Build Your Plan
Pick a base tier, stack the add-ons and API you need, and see your total update live. Every plan includes all markets.
How pricing works
Create an account for a 14-day free trial — every dashboard tab except Market Report, across all markets, no card required. Upgrade anytime.
Pay monthly, or choose yearly billing and save 17% on the whole cart — tier, add-ons and API. Use the toggle above to compare.
You log into the dashboard with a password; data pulls use a separate API key. Basic is web only and cannot add API at any price. Standard includes the Feed key (100/min, 24h history); upgrade to Signal (300/min, real-time) or Edge (600/min, proprietary models). Enterprise is custom with a WebSocket feed.
Payment via Stripe or USDT (Coinbase).
Start free — no card required
Create an account for a 14-day free trial: every dashboard tab except Market Report, across all markets. Upgrade anytime for API access and add-ons.